Unravel bugs with time-travel debugging
Rewind, pause, and fast-forward through your code's execution - gain an unprecedented level of control and insight into your code's behavior.

Struggling with slow bug resolutions and code comprehension?
Debugging takes time due to complex, interconnected codebases, difficulty in recreating problems. Limited visibility into code execution and the need for trial and error further contribute to the time taken.
Efficiency Amplified
Save time and effort by eliminating the need for endless console.logs and guesswork. xTrace provides a visual representation of code execution, allowing you to pinpoint issues faster.
Instant Features
Duis aute irure dolor in reprehenderit in voluptate velit esse cillum dolore eu fugiat nulla pariatur. Excepteur sint occaecat cupidatat.
Instant Features
Duis aute irure dolor in reprehenderit in voluptate velit esse cillum dolore eu fugiat nulla pariatur. Excepteur sint occaecat cupidatat.
Instant Features
Duis aute irure dolor in reprehenderit in voluptate velit esse cillum dolore eu fugiat nulla pariatur. Excepteur sint occaecat cupidatat.
Instant Features
Duis aute irure dolor in reprehenderit in voluptate velit esse cillum dolore eu fugiat nulla pariatur. Excepteur sint occaecat cupidatat.
Instant Features
Duis aute irure dolor in reprehenderit in voluptate velit esse cillum dolore eu fugiat nulla pariatur. Excepteur sint occaecat cupidatat.
Record and replay code execution, fix bugs
Say goodbye to the frustration of traditional debugging methods and embrace the power of time travel debugging.
Fix bugs faster
Save time spent in reproducing bugs
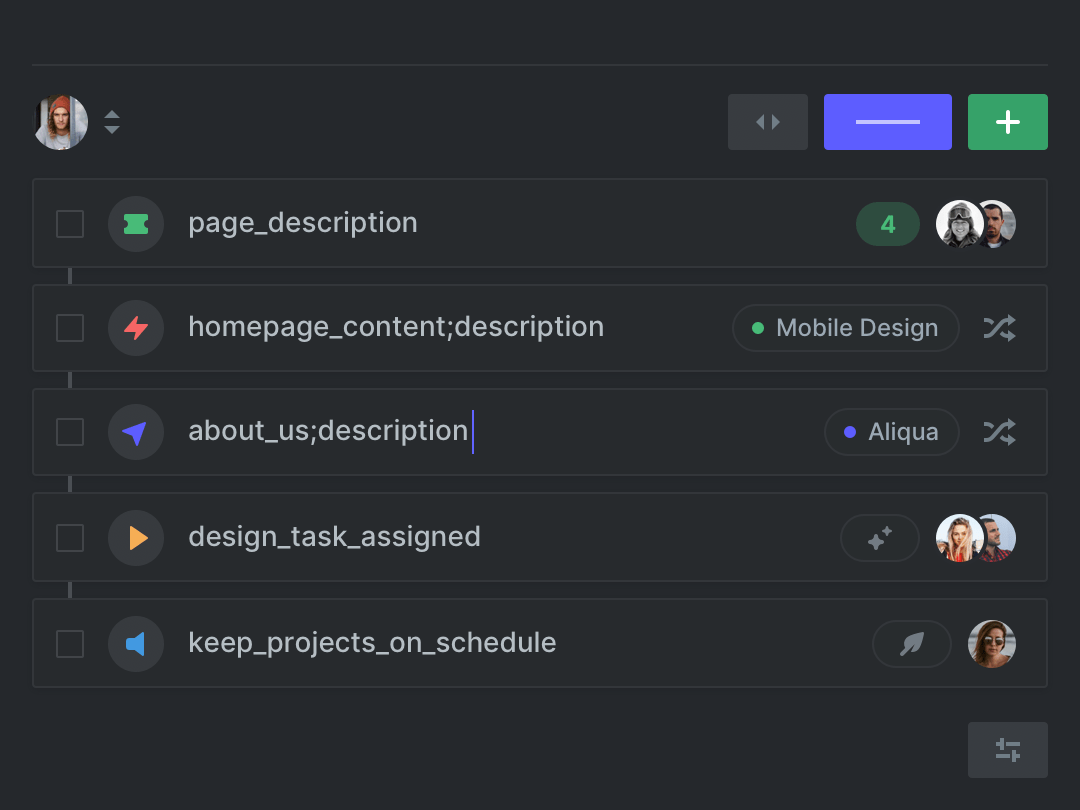
- Record code execution, variable at any stage
- Replay code execution in any browser
- No need to reproduce bugs to debug
Resolve your customer issues with ease
Minimize interaction with customers while tackling production issues.
- Record code execution of production issues on demand
- Developers can debug recorded code-execution from any location
- Full code level debugging with variable inspector makes it a breeze to fix issues
Trying to understand a new code
Watch the code come to life with time travel debugging
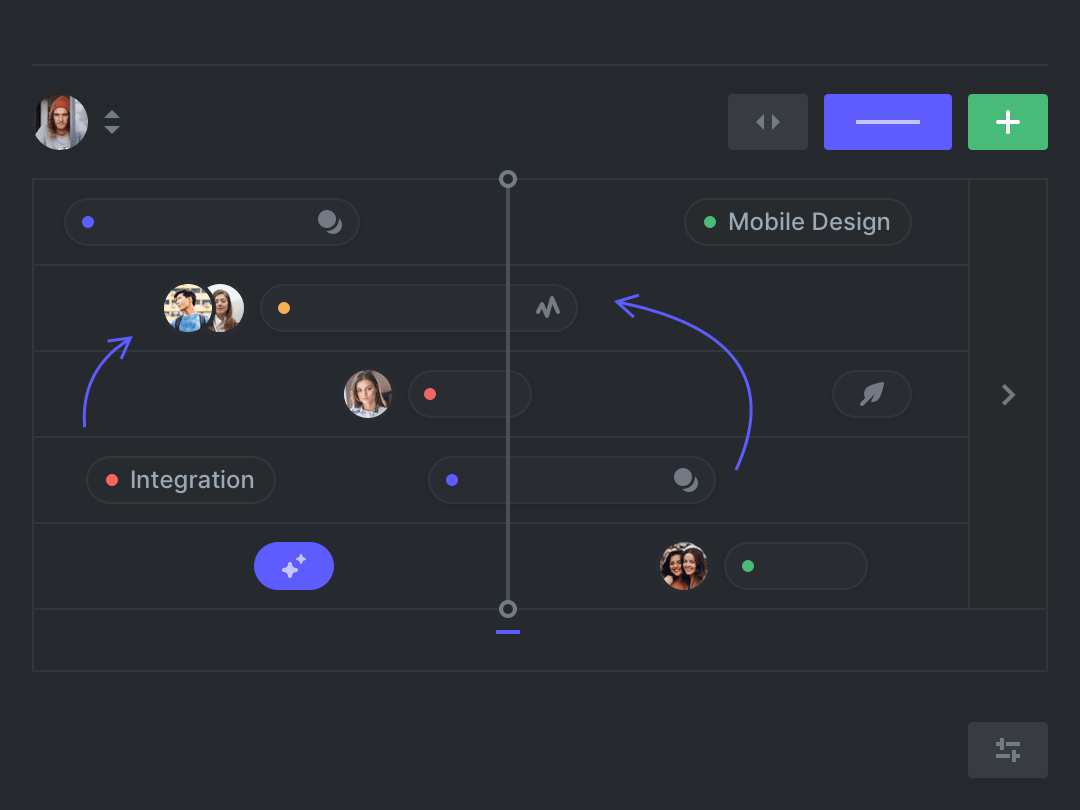
- Go forward or backward in code execution until you understand the code
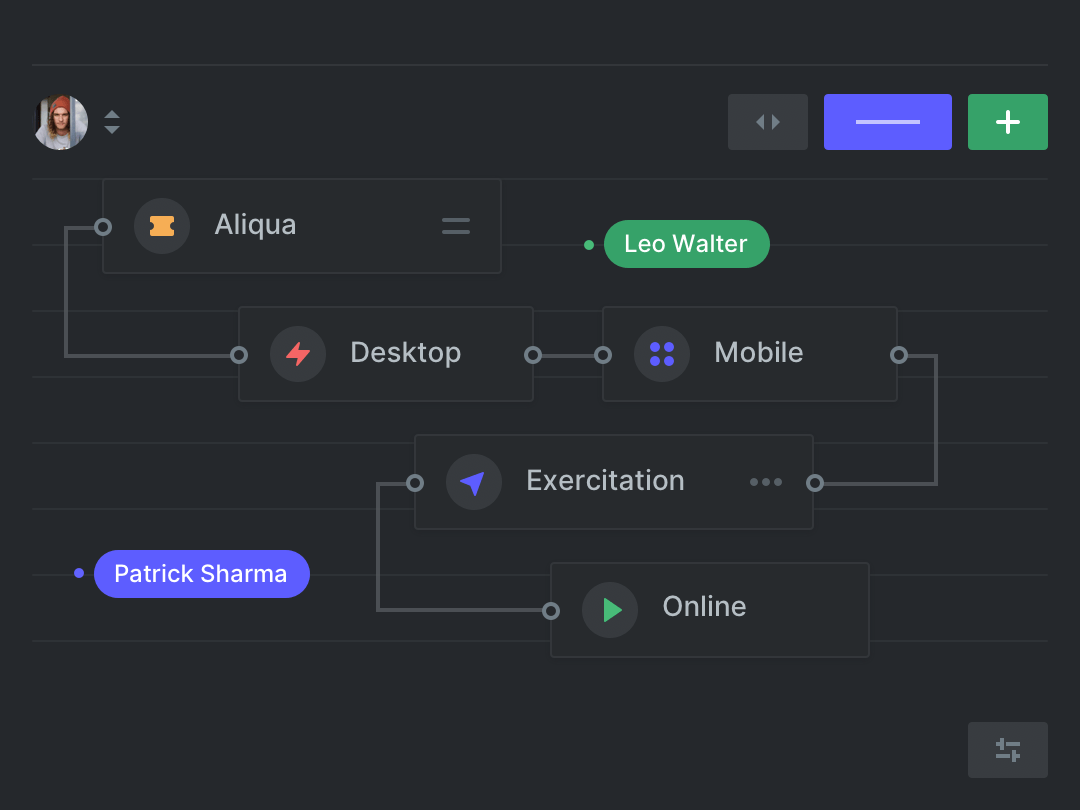
- Get a code overview with auto generated sequence diagrams
- For any code section, discover the scenarios when the code is hit
Don't take our word for it
Vitae aliquet nec ullamcorper sit amet risus nullam eget felis semper quis lectus nulla at volutpat diam ut venenatis tellus—in ornare.
— Open PRO lets me quickly get the insights I care about so that I can focus on my productive work. I've had Open PRO for about 24 hours now and I honestly don't know how I functioned without it before.
— Open PRO lets me quickly get the insights I care about so that I can focus on my productive work. I've had Open PRO for about 24 hours now and I honestly don't know how I functioned without it before.
— Open PRO lets me quickly get the insights I care about so that I can focus on my productive work. I've had Open PRO for about 24 hours now and I honestly don't know how I functioned without it before.
Stay in the loop
Join our newsletter to get top news before anyone else.